Site Overview
This is the landing page for a specific site — reached by clicking its name in the nav, or "Open site →" from the All Sites Directory. It's a single-screen summary of everything currently happening at that site.
What you'll see
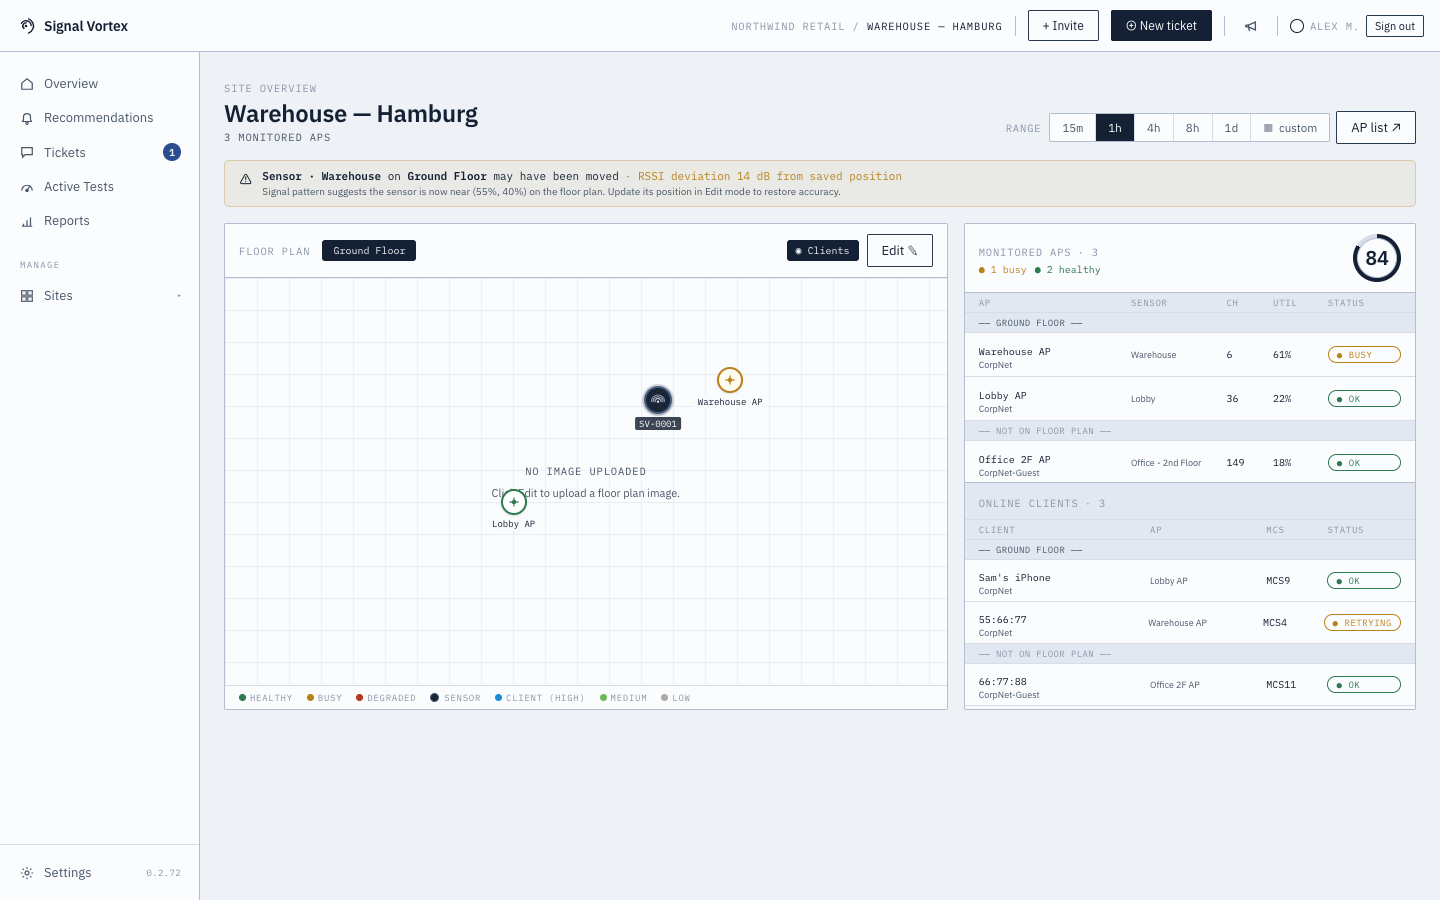
- A Site status bar (In production or Refresh planned) — see Network Refresh: Before and After to compare the network before and after a refresh.
- A header with the site name, how many APs are monitored, how long it's been monitored, and a time range picker that controls the charts below.
- Sensor displacement alerts — if a sensor's signal pattern no longer matches where it's marked on the floor plan (suggesting it's been physically moved), a warning banner appears naming the sensor, the floor, and the RSSI deviation, with an estimated new position when there's enough data to guess one. See Floor Plans for how to update a sensor's saved position.
- An interactive floor plan on the left (the same editor described in Floor Plans).
- A monitored-AP health list on the right, grouped by floor, each row showing its sensor, channel, utilization, and status — click any row to jump to the full Access Points view.
- An online-clients list below that, also grouped by floor, showing which AP each client is on and its connection quality (MCS index).
- A metrics timeline spanning the bottom: health score, per-AP RSSI, and per-channel airtime utilization over the selected time range, each with a dashed reference line for the same metric one day earlier.
Why it matters
Most "what's wrong right now" questions are actually "what's wrong at this specific site right now" — this page answers that in one place: the physical picture (floor plan), the technical picture (AP/client health), and the historical picture (timeline), instead of three separate screens.